

Give Feedback - What's New - FAQs - Contact - Disclaimer
Layers 
Clear Drawing Graphics
Driving Directions
Zoom In
Zoom Out
Full Extent
Previous Extent
Next Extent
Pan
Identify Tool
Measure Length Tool
Drawing Tool
Print
Submit
Submit
Submit
Find intersection (e.g. Easy/Jefferson Davis)
Submit
Northing/Easting in VA State Plane
Submit
Longitude/Latitude in Decimal Degrees
Submit
Select Layer 
Submit
4 Miles


 Loading Map...
Clear Result
No results available
Loading legend....
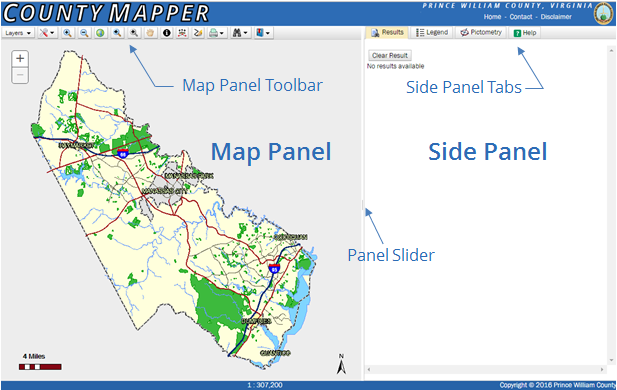 |
The County Mapper application display is split into two panels with a slider control in between them. This slider allows you to click and drag horizontally to resize the panels in your browser window.
|
There are several ways to navigate the map. Descriptions of each method are detailed below. The default method when the application loads is the mouse-keyboard method. Whichever method is used the current map scale is displayed centered at the bottom of the window and, when the mouse is within the map, its coordinates are displayed at lower left.
Using Mouse-Keyboard:
Using the Zoom Slider Control on Map:
Using the Overview Map:
Using Mouse-Keyboard:
- to Activate: Select Enable Mouse Navigation from the Map Tools menu.
- to Pan: Click and drag in the map.
- to Zoom In:
- Double-Click on map or
- Mouse Scroll Forward or
- Hold the SHIFT key while clicking and dragging a rectangle.
- to Zoom Out:
- Mouse Scroll Backward or
- Hold the SHIFT and CONTROL keys while clicking and dragging a rectangle.
- To Recenter: hold the SHIFT key + click on map.
- to Activate a Tool: Click the tool button in the toolbar.
 Zoom In/Center Tool: Once active, click or double-click on the map to zoom in one scale increment and center the map on the click point. Click and drag a rectangle to center the map and zoom to the scale increment closest to the extent of the user rectangle.
 Zoom Out/Center Tool: Once active,click or double-click on the map to zoom out one scale increment and center the map on the click point. Click and drag a rectangle to center the map and zoom to the scale increment closest to the extent of the user rectangle.
 Full Extent Button: Click button to zoom map to full Countywide scale.
 Previous Extent Button: Click button to zoom to previously viewed map extents stored during this session.
 Next Extent Button: Click button to zoom to next stored map extent. Only available after Previous Extent Button has been used.
 Pan Tool: Once active, click and drag on the map to change extent.
Using the Zoom Slider Control on Map:
 With the Zoom Slider Control, click on the + to Zoom In or the - to Zoom Out.
Using the Overview Map:
- Click
 in the upper right corner of the map to show the Overview Map.
 - The current extent of the main map is represented by a red rectangle in the Overview Map.
- Drag the red rectangle to navigate to a new location.
- Click in the upper right corner of the map to hide the Overview Map.

Map Tools Menu
- Show Parcel Info: Available when Parcels are at scales of 1:4,800 or below. Selecting this menu option enables the application to return address and GPIN information via a pop-up window when the mouse is hovered over a Parcel feature. To disable this option select Hide Parcel Info in the Map Tools Menu.
- Enable Mouse Navigation: Select this menu option to activate the mouse-keyboard method for navigating the main map.
- Undo Last Drawing: Available after a drawing graphic has been added to the map. Selecting this option removes the most recently drawn graphic in the current map session.
- Clear Drawing Graphics: Selecting this option removes all graphic map overlays created with the Drawing Tools in the current map session.
- Clear Search Graphics: Selecting this option removes all graphic map overlays created when using the Search or Identify Tools in the current map session.
- Clear All Graphics: Selecting this option removes all graphic map overlays from the map.
- Driving Directions: Select this option as a shortcut to get driving directions from the Google Maps Driving Directions service.
 Identify Tools
- The tools in this set allow you to retrieve additional information about features in the map display.
- Moving the mouse over the Identify Tool button in the toolbar above the map will open the Identify Tool Settings dialog:
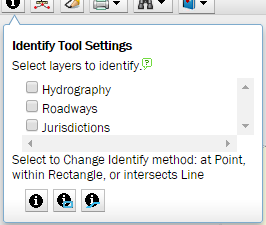
- The names of layers currently visible in the map are listed in the dialog. Each layer listed has a corresponding checkbox. A layer MUST be visible to identify any of its features.
- Click in the checkboxes to place a check in the box and activate that layer for use with the Identify Tool. Uncheck to deactivate.
- You may select up to 10 layers as active, however, the more layers selected the longer the identification operation takes.
- Click one of the dialog buttons to select an Identify Method and to make it the active map tool. Features can be identified using one of the methods below:
- Identify at Point: Click a point on the map and the application will highlight and return results for features that are located at that point.
 Identify with Rectangle: Click and drag a rectangle on the map and the application will highlight and return results for features that are within the rectangle or intersect with its boundary.
 Identify with Line: Click to add multiple points defining a line on the map and the application will highlight and return results for features that are crossed by the line.
- Move the mouse off of the Identify Tool Settings dialog to close it
- Settings are retained for the duration of the map session or until changed.
- Identify results are displayed in the Results tab panel to the right of the map
 Measure Tools
- The tools in this set allow you to get distance, area and/or coordinate information about features on the map display.
- Moving the mouse over the Measure Tool button in the toolbar above the map will open the Measure Tool Settings dialog:
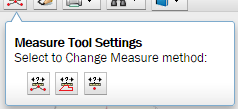
- Click one of the dialog buttons to select a Measure Method and to make it the active map tool. The measurement method options are described below:
- Measure Length: Click to add multiple points defining a line on the map and the application will return its length in feet and miles.
 Measure Area: Click to add multiple points defining a polygon on the map and the application will the area in square feet and acres as well as the perimeter length in feet and miles.
 Get Coordinates at Point: Click a point on the map and the application will return its coordinates in VA State Plane coordinate system and Latitude/Longitude.
- Move the mouse off of the Measure Tool Settings dialog to close it
- Settings are retained for the duration of the map session or until changed.
- Measurement results are displayed in the Measurement Results dialog that will open on the screen.
 Drawing Tools
- The tools in this set allow you to add graphics (point, line, polygon, and text) to the map display.
- Moving the mouse over the Drawing Tool button in the toolbar above the map will open the Drawing Tool Settings dialog:
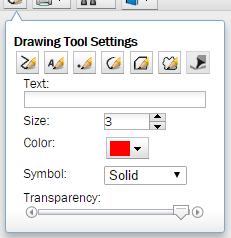
- Click one of the dialog buttons to select a Drawing Method and to make it the active map tool. The drawing method options are described below:
- Draw Line: Click to add multiple points defining a line on the map. The line thickness, color and transparency values can be altered using the controls in the Drawing Tool Settings Dialog.
 Draw Text: Enter text in the settings dialog, then click within map to add the text. The font size, color and transparency values can be altered.
 Draw Point: Click within map to add the a point symbol. The symbol and its size, color and transparency values can be altered.
 Draw Freehand Line: Click and hold down the mouse button within map and drag to define a line. The line thickness, color and transparency values can be altered.
 Draw Polygon: Click to add multiple points defining a polygon on the map. The outline thickness, color, polygon fill pattern and transparency values can be altered.
 Draw Freehand Polygon: Click and hold down the mouse button within map and drag to define a polygon. The outline thickness, color, polygon fill pattern and transparency values can be altered.
 Draw Highlighted Parcel: Available when Parcels are within visisble scale (1:19,200 or below). Click within a parcel feature and the parcel boundary is added as a graphic. The line thickness, color and transparency values can be altered.
- Move the mouse off of the Measure Tool Settings dialog to close it
- To remove the last or all drawn graphics, use the options under the Map Tools Menu described in this document above.

Print Tool
- This tool allows you to create a printable document of the information from this web application.
- Click the Print Tool button in the toolbar above the map to open the print dialog:
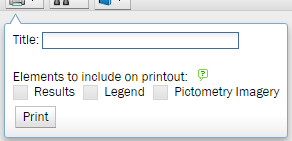
- By default the print layout will include a map image as close as possible to what is viewed on your screen. Page orientation (portrait/landscape) is dependent upon the height to width ratio of the map in your browser window.
- If desired, the printout can be titled by adding text in the Title input box. The title will be added to the top of the first print page.
- Place a check in the checkbox next to the additional elements you want to include in the print layout. Note that the checkboxes are enabled only after the individual element has been activated. For instance, the Results box is only active if a tool, such as an Identify tool, has previously returned information to the Results Tab. The Legend checkbox is available only after the Load Legend button has been clicked in the Legend Tab. The Pictometry checkbox is only available after the Pictometry Tab has been made the active tab and the Pictometry images have been loaded for viewing.
- The Legend and Results elements, if selected, are added to the print layout on the page(s) after the Title/Map page.
- If the Pictometry element is added to the print layout, the first page is forced into landscape orientation with both the map image and the Pictometry image being displayed with roughly the same size ratio as was visible in your browser window.
- Click the Print button to generate and download a .pdf of the print layout. NOTE: If the browser does not indicate that the download occured, it may have been blocked by a pop-up blocker. If that is the case add an exception for https:\\gisweb.pwcgov.org to the pop-up blocker settings for your browser.

Search Tool
- The tools in this set allow you to quickly locate a feature or location within the map.
- Click the Search Tool button in the toolbar above the map to open the search dialog:
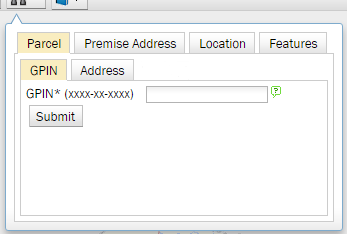
- The dialog is divided into four tabbed categories each with their own search input criteria; some having tabbed subcategories.
- To perform a search, click on the catagory tab of your choice and, if necessary, any subcategory tab to display the appropriate search input controls. Provide the search input information (an * indicates a required field). Hovering the mouse over the question mark balloon image in the dialog will provide hints about the type and format of the information expected. Lastly click on the Submit button.
- Search results are displayed under the Results tab to the right of the map.

Bookmark Tool
- The tools in this set allow you to save/retrieve map configurations for quick map navigation and setup.
- By Extent saves the current extent of the map display. This is a spatial bookmark. Clicking Go next to a saved entry will return the map to that extent.
- Layers saves current layer list configuration. Clicking Go next to a saved entry sets the visibility of the layers from the stored list.
- Each configuration can be given a name of your choosing for ease of use.
- This feature requires cookies to be enabled in the browser for this site.
This is where you select which data layers to display on the map. There are more than seventy layers to choose from residing in nine categories.
- Click the Layers button in the toolbar above the map to open the Map Layers Dialog:
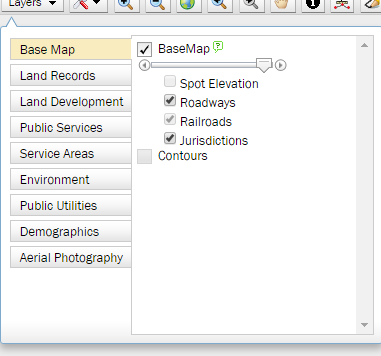
- Click a category name on the left side to display the list of layers in that category.
- Checking/Unchecking the box next to the category name will show/hide all layers in that category on the map.
- Checking/Unchecking the box next to an individual layer name will show/hide that layer on the map.
- Use the slider control to adjust the transparency for all the layers in that category.
- Some individual layers are scale dependent, which means they are available to display on the map only at certain scale levels. For example, the Railroads layer is available when map scale is larger than 1:153,600. If a layer is out of scale, its checkbox will be greyed out/disabled. (see above image)
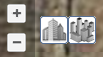
- There are additional controls on the Aerial Imagery tab that allow you to display different years of aerial imagery on the map:
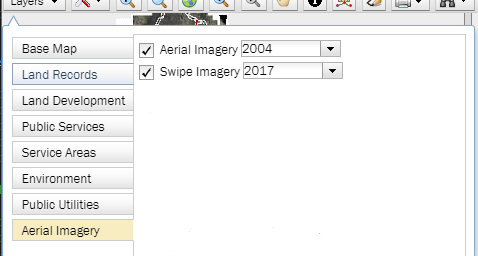
- Checking/Unchecking the Aerial Imagery box will show/hide the imagery layer selected in the drop-down pick list to the right.
- To select a different imagery year, click on the down arrow of the drop-down to display the pick list, then click on a list item.
- Checking/Unchecking the Swipe Imagery box will show/hide an additional layer of imagery over top of the Aerial Imagery layer in the map along with a special "swipe" control that allows you do a visual comparison of the imagery layers. To use the swipe control, click on the larger grey handle and drag left or right. Labels on the control indicate which imagery layer is being displayed on either side of the swipe boundary.
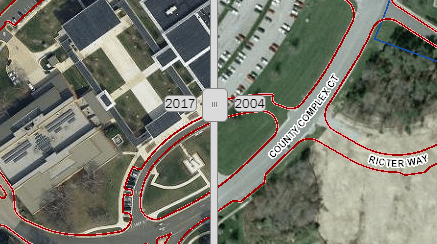
- Again to select a different swipe imagery year, click on the down arrow of the drop-down to display the pick list, then click on a list item.

Results
- Clear Results: Click this button to clear the data from the Results Tab and remove its associated graphics from the map.
 Zoom to Identified: Click this button to zoom to the extent of all features listed in the Results Tab.
- Zoom to Record: Click this button to zoom to the extent of the feature associated with this record.
 Highlight Record: Hover the mouse over this button to highlight the identified feature on the map.
 Remove from Results: Click this button to remove this record from the set of returned results.
- List Adjoiners: Available for parcel features, click this button to return a list of all parcels that are adjacent to the subject parcel.
- Tax Info: Available for parcel features, click this button to retrieve tax information about the subject parcel by launching an instance of the Real Estate Assessment web application.
- More Info: Available for parcel and premise address features, click this button to return additional information pertaining to the subject feature's location. Items returned include schools, voting precinct, polling place and more.
- Driving Directions: If the subject feature has a street address, the Driving Directions link will enable you to easily use the Google service to get driving directions to the subject address.
- Miscellaneous Links: Some data layers will have links to resources that will provide more indepth information. Clicking on the link will open a new browser window/tab.

Legend
- Click the Load Legend button to initialize and request the legend to display.
- Once initialized the legend display will update with changes in map scale and map layer visibility.
- To view a map layer's metadata, click on the
 icon in the legend to open the linked document.

Pictometry
 pictometry location icon.
- Click on the Pictometry tab to initialize and connect with the imagery. The viewer has tools to help interact with the images:
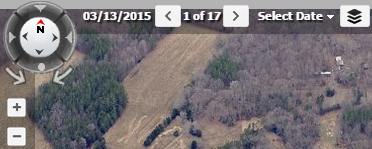
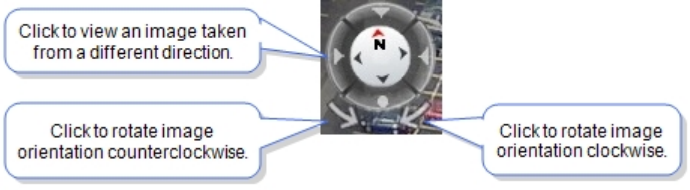
- Compass: Indicates how the current image is oriented. As you view images captured from different directions, the compass rotates so that the direction shown at the top of the compass always matches the direction at the top of the image shown. The red arrow next to the "N" always points north. Click one of the arrows or the dot on the compass to view the same location from a different direction (north, south, east, west, or from directly above). Click one of the two arrows at the bottom of the compass to rotate the image orientation by 90° in either a clockwise or counterclockwise direction.
- Date of Capture: The date displayed to the right of the Compass is the date that the currently visible image was taken.
- Zooming In/Out: Zooming in and out allows you to view images taken from different altitudes. Use the plus/minus buttons or the predefined level "shortcut" buttons to change the zoom level.
- Image List: If more than one image of the same (or similar) orientation is available for the current location at the current zoom level, you can swap the current image for another. The Image list (the numbers between the Next Image and Previous Image buttons) indicates how many images of the current location, orientation, and zoom level are available to view with the Next and Previous Image buttons, and which one you are currently viewing.
NOTE: The Image list is updated every time you change the zoom level, click a navigation button, or select a different capture year. Sometimes the list is updated when you pan an image also.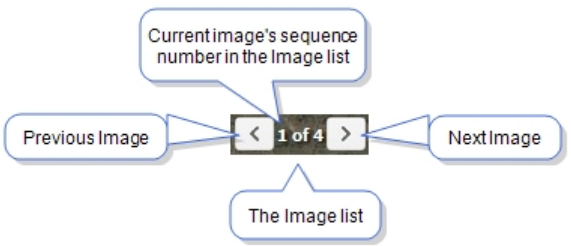
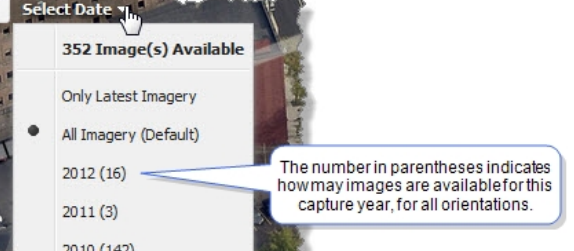
- Select Date: By default, images from all capture years are available in the Image list and with the navigation buttons. However, you can limit the images available for viewing to just the most current ones or to images from a particular capture year. The Select Date list shows the total number of images available (352 in the example shown) for the current location, and the number of images available by capture year for the current location and zoom level.
 Layers: The Layers button lists the GIS layers you can overlay on the Pictometry images. Select the check boxes for the layers you want to display. Clear the check boxes for layers you don’t want displayed.
Browsers supported:
- Best viewed using Chrome v.44, Internet Explorer 11, Firefox v37 or later versions.
- Other browsers or earlier versions are not fully tested
- This application was designed for desktop display on screens 600x800 or larger.
- Smaller screens may affect display of the application.
- Internet connection required
- JavaScript needs to be enabled
- "Bookmarks" function requires Cookies to be enabled
- Print function may need a pop-up blocker exception added for https://gisweb.pwcgov.org