Give Feedback
-
What's New
-
FAQs
-
Home
-
Contact
-
Disclaimer
Layers
Select options below to render Census Data
Demographic Year / Aggregation Level:
Filter Data Field list relevent to:
Data Field for Classification Values:
Classification method:
Standard Deviation Interval:
Number of Classes:
Color Scheme:
Add a Custom Data Layer:
Add
Zoom In
Zoom Out
Full Extent
Previous Extent
Next Extent
Pan
Identify Tool
Elements to include on printout:
Print
Display Help Panel
4 Miles
Loading Map...
Loading legend....
Clear Results
No Features Identified.
Use the Identify Tool to select features in the map or click on a table row in the Data Table tab. The results will be displayed here.
The purpose of the Demographic Mapper is to allow the user to visualize individual attributes within the demographic data to better understand the "where" with the "what" in the data. Classification options enable the user to change the display of the data to help highlight any desired aspects as a simple form of analysis. By
default the data is rendered (or colored) using the values of the Total Population data field and the values are classified into 5 classes as indicated in the Legend Tab. However, you can change the data field used for rendering (there are over 250), the number of classes, the mathematic method used to classify the data, and the color used; all to better
understand the demographic makeup of the County. If you are interested in the demographics of a specific area, you can use the Identify tools to see information and charts about all the available data fields for that area. Note that even though all data fields are being returned, the map layer is rendered by the values of only one field at a time.
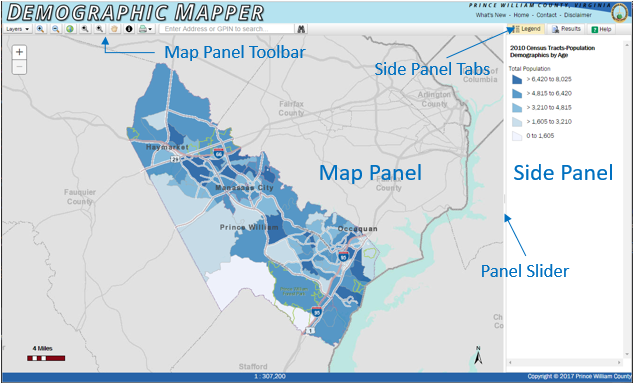
Below is a labeled image of the website to introduce you to terms that will be used later in this documentation to refer to different areas. Please take some time to familiarize yourself with them before reading further.
The application display is split into two panels with a slider control in between them. This slider allows you to click and drag to resize the panels in the horizontal direction.
The panel on the left is the Map Panel in which the map is displayed. Within the Map Panel is the Map Panel Toolbar containing tools that allow you to interact with the map to retrieve the information you desire.
The panel on the right is the Side Panel in which different information will be displayed. Within the Side Panel are the Side Panel Tabs that allow you to control the type of information displayed within the Side Panel.
More information about each panel can be found in the help sections below.
Displaying Demographic Data
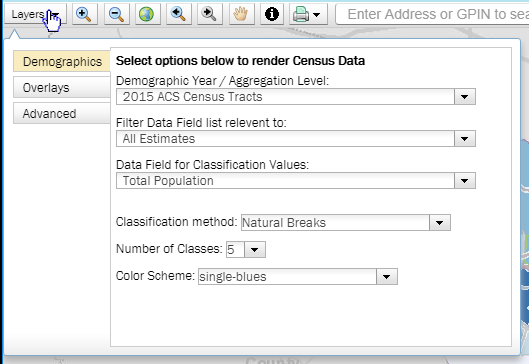
To change the way the Demographic data is displayed in the map, select options in the Map Layers Dialog:
Click on the Manage Map Layers button to open the Map Layers Dialog:
Select the options from the pick-lists:
Demographic Year / Aggregation Level: Contains the options for survey year and geographic data aggregation level. Options in the Data Field and Filter pick-lists are updated and the map is refreshed when a selection is made.
Filter Data Field: If desired, use this pick-list to limit the options listed in the Data Field pick-list.
Data Field: Contains the data attributes that can be used to classify the data for display.
Number of Classes: Select the desired number of class breaks to render.
Color Scheme: Select the colors used to display the demographic data.
The results of most option changes are immediately applied to the map and legend displays.
Displaying Overlay Data
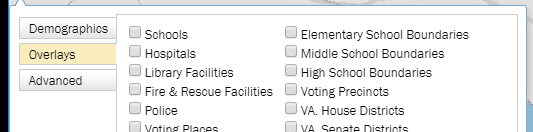
Additional map data layers have been included to help add context to the demographics:
Open the Map Layers Dialog and select the Overlays tab:
Toggle the visibility of the various layers by checking/unchecking the box next to the layer name.
Adding Your Own Data
If you know of data served as mapservices you can add them to the map as custom layers:
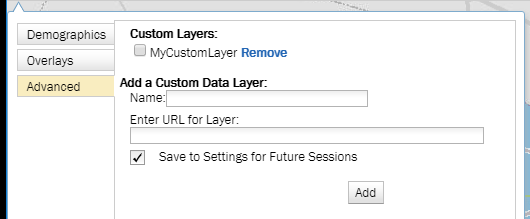
Open the Map Layers Dialog and select the Advanced tab:
Enter a name for the custom layer that is meaningful to you into the "Name" text input box.
Enter the URL for the online map service resource. For example: https://gisweb.pwcgov.org/arcgis/rest/services/CountyMapper/PublicServices/MapServer/6
To keep this information and automatically add the custom layer in future Demographic Mapper sessions, check the box labelled "Save to Settings for Future Sessions". Otherwise the custom
layer will only be included on the map until you close your browser or navigate away from the Demographic Mapper site.
Click the "Add" button. If the resource is published through ArcGIS Online, you will be prompted for your sign in credentials.
A new checkbox entry for your layer will be added in the "Custom Layers" section of the dialog. Use this checkbox to control visibility of your custom layer. To remove a custom layer from
the map and any future browser sessions if it has been saved, click on the "Remove" link next to the custom layer's name.
There are a couple of ways to navigate the map. Descriptions of each method are detailed below. Whichever method is used the current map scale is displayed centered at the bottom of the window and, when the mouse is within the map, its coordinates are displayed at lower left.
Using Navigation Tools on Toolbar:
to Activate a Tool: Click the tool button in the toolbar.
Zoom In Tool: Once active, click + drag a rectangle on the map.
Zoom Out Tool: Once active, click + drag a rectangle on the map.
Full Extent Button: Click button to zoom map to full Countywide scale.
Previous Extent Button: Click button to zoom to previously viewed map extents stored during this session.
Next Extent Button: Click button to zoom to next stored map extent. Only available after Previous Extent Button has been used.
Pan Tool: Once active, click + drag on the map to change extent.
Using the Slider Control on Map:
With the Slider Control, click on the + to Zoom In or the - to Zoom Out.
Manage Map Layers Tool:
Use this tool to change the display of Demographic features in the map.
For more details see the Displaying Demographic Data section above in this help system.
Navigation Tools:
Zoom In Tool: Once active, click + drag a rectangle on the map.
Zoom Out Tool: Once active, click + drag a rectangle on the map.
Full Extent Button: Click button to zoom map to full Countywide scale.
Previous Extent Button: Click button to zoom to previously viewed map extents stored during this session.
Next Extent Button: Click button to zoom to next stored map extent. Only available after Previous Extent Button has been used.
Pan Tool: Once active, click + drag on the map to change extent.
Slider Control: click on the + to Zoom In or the - to Zoom Out.
Identify Tools:
The identify tools allow you to retrieve additional information about the features displayed in the map. If multiple demographic features are selected with the
identify tools, the demographic values and charts returned as a "Summary" record will reflect a compilation of the values of all the selected features. Please note that some values in the data are a result of more complex analysis done by the US Census Bureau and cannot be accurately recompiled
into the Summary record and therefor will be omitted. To view those field values, we recommend identifying each feature individually.
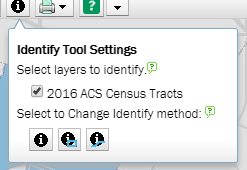
Moving the mouse over the Identify Tool button in the toolbar above the map will open the Identify Tool Settings dialog:
For each identifiable layer visible in the map, there will be a checkbox added to the Itentify Tool Settings dialog. Click on the checkboxes to select the layers you want the active Identify Tool to interact with.
Click one of the dialog buttons to select an Identify Method and to make it the active map tool. Features can be identified using one of the methods below:
Identify at Point: Click a point on the map and the application will highlight and return results for features that are located at that point.
Identify with Rectangle: Click and drag a rectangle on the map and the application will highlight and return results for features that are within the rectangle or intersect with its boundary.
Identify with Line: Click to add multiple points defining a line on the map and the application will highlight and return results for features that are crossed by the line.
Move the mouse off of the Identify Tool Settings dialog to close it.
Settings are retained for the duration of the map session or until changed.
Identify results are displayed in the Results tab of the Side Panel to the right of the map, the corresponding features will be highlighted on the map, and the table rows will be selected in the Data Table tab.
Holding down the Ctrl key while using an Identify tool with previously identified features will Add features to the Summary record.
Holding down the Shift key while using an Identify tool with previously identified features will Remove features from the Summary record.
Print Tool:
This tool allows you to create a printable document of the information from this web application.
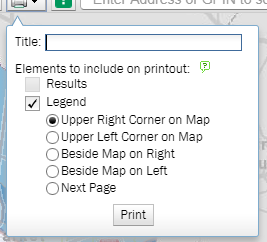
Click the Print Tool button in the toolbar above the map to open the print dialog:
By default the print layout will include a map image as close as possible to what is viewed on your screen. Page orientation (portrait/landscape) is dependent upon the height to width ratio of the map in your browser window.
If desired, the printout can be titled by adding text in the Title input box. The title will be added to the top of the first print page.
Place a check in the checkbox next to the additional elements you want to include in the print layout. Note that the Results checkbox is only enabled if features have been identified and the
returned information is displayed in the Results Tab. The Results will be added to the print layout on the page(s) after the Title/Map page.
The default Legend placement is in the upper right corner of the map. To change Legend placement, click in the radio button labelled with the desired location. Because there is the potential for the legend to outgrow the space alloted, not all legend placement choices will produce acceptable cartographic layouts. If the legend does not display properly in your print document, try a different legend position.
Click the Print button to generate and download a .pdf of the print layout. NOTE: If the browser does not indicate that the download occured, it may have been blocked by a pop-up blocker. If that is the case add an exception for http:\\gisweb.pwcgov.org to the pop-up blocker settings for your browser.
Address or GPIN Locator:
This tool searches for and indicates the location of an address or Geographic Parcel ID Number (GPIN) within Prince William County. A graphic is placed and the map centered on the located point.
To use this tool, type in an address or GPIN. As you type suggested addresses will display. Either click on one of the suggested addresses or click on the Search (binoculars) button.
To clear the location graphic, click on the X to the right inside the input box.
Results
The Results tab is where information about demographic map features is displayed in response to the Identify functions. Additional function/tools available in the Results Tab:
Clear Results: Click this button to clear the data from the Results Tab and remove its associated graphics from the map.
Zoom to Identified: Click this button to zoom to the extent of all currently Identified features.
Data Table
In the Data Table tab, information about demographic map features is displayed in tabular form. The table displayed here contains the raw numbers used to make the charts and other information displayed in the Results tab as well as to calculate the rendering of the layer in the map. The table is interactive and synched with the map. Whether you click on a table row here or use an Identify tool and click on the map to select a feature, both the row and map feature will be highlighted and results will display in the Results tab.
Click within a row to Select. The row and corresponding map feature will be highlighted plus results will display in the Results Tab. Holding down the Ctrl key while clicking a row will allow you to add/subtract the clicked row to/from the selection set. Holding down the Shift key while clicking will allow multiple rows to be added to or subtracted from the selection set.
To resize a column, hover mouse cursor over line between columns. When cursor changes to the slider icon, click and drag.
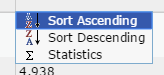
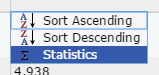
Column Context Menu:
To Sort the table rows, click on the header of the column you want to sort by and a context menu will be displayed: Click on Sort Ascending or Sort Descending to sort. To return table to the original order choose Default Sort Order from the Table Options menu.
To get Statistics from a column with numeric values, click on the header and a context menu will be displayed: Click on Statistics and a dialog window will open containing the basic statistics for the values in the column.
Table Options Menu:
Show/Hide Columns: Select this option or click on the shortcut icon to display a list of table columns with check boxes. To hide a column from being displayed in the table, clear its checkbox. To show a column, check its checkbox.
Default Sort Order: This option returns the table display to its original row sort order.
Clear Selection: This option functions like the Clear Results button in the Results Tab. It clears both table and map selections.
Center on Selection: This option centers the map view on the selected features/rows.
Save Columns to Settings: Use this option to store a custom list of columns to be visible in the table as a named list. This way they can be easily recalled in future sessions. Existing lists can be edited and overwritten if desired. This function requires that Cookies be enabled for this site.
Load Columns from Settings: This option allows you to reload the table displaying only the fields from a previously saved list of your choosing. If lists exist you will be prompted with the Saved Column Settings dialog displaying all Saved Column Lists associated with your profile. Click Load to reload the table. Click Delete to remove the Saved Column List from the Settings.
Export Table to .csv File: Select this option to download the tabular data as a comma delimited text file. You will be prompted with the Export Table Options dialog:
Export only Visible Columns: Check this box to export only the columns in the currently loaded table that are checked as Shown in the Hide/Show Columns dialog. Uncheck this box to export all table columns.
Export only Selected Rows: Check this box to export data for Selected rows only. Uncheck this box to export all table rows.
Click the Export button to start the download. Depending upon your browser settings you may be prompted further to finish the file download.
Legend
The Legend tab displays a legend explaining the symbols used to display the Demographic data and the other layer data in the map.
This legend display will update with changes made to the options selected in the Manage Map Layers dialog.
Browsers supported:
Best viewed using Chrome v.44 or higher, Internet Explorer 11, Microsoft Edge, or Firefox v51.0.1 or higher.
Other browsers are not fully tested
Screen Size:
This application was designed for desktop display on screens 600x800 or larger.
Smaller screens may affect display of the application.
Other Requirements
Internet connection required.
JavaScript needs to be enabled.
To save table column settings and/or custom map layers, Cookies need to be enabled in your browser.
Print function may need a pop-up blocker exception added for http://gisweb.pwcgov.org.
Map Data
The information contained throughout this site is not to be construed or used as
a "legal description". Map information is believed to be accurate but accuracy is
not guaranteed. Any errors or omissions should be reported to the Prince William
County Geospatial Technology Services Program under the Enterprise Applications
Division of the Department of Information Technology.
In no event will Prince William County be liable for any damages, including loss
of data, lost profits, business interruption, loss of business information or other
pecuniary loss that might arise from the use of this map or the information it contains.
Browsers
This web site can be best viewed using Chrome v42, IE v10, or Firefox v37. Older version browsers
are not fully tested and supported.


 Loading Map...

 Zoom In Tool: Once active, click + drag a rectangle on the map.
 Zoom Out Tool: Once active, click + drag a rectangle on the map.
 Full Extent Button: Click button to zoom map to full Countywide scale.
 Previous Extent Button: Click button to zoom to previously viewed map extents stored during this session.
 Next Extent Button: Click button to zoom to next stored map extent. Only available after Previous Extent Button has been used.
 Pan Tool: Once active, click + drag on the map to change extent.
 With the Slider Control, click on the + to Zoom In or the - to Zoom Out.
 Manage Map Layers Tool:
 Identify Tools:
 Identify with Rectangle: Click and drag a rectangle on the map and the application will highlight and return results for features that are within the rectangle or intersect with its boundary.
 Identify with Line: Click to add multiple points defining a line on the map and the application will highlight and return results for features that are crossed by the line.
 Address or GPIN Locator:

 Zoom to Identified: Click this button to zoom to the extent of all currently Identified features.
 shortcut icon to display a list of table columns with check boxes. To hide a column from being displayed in the table, clear its checkbox. To show a column, check its checkbox.
